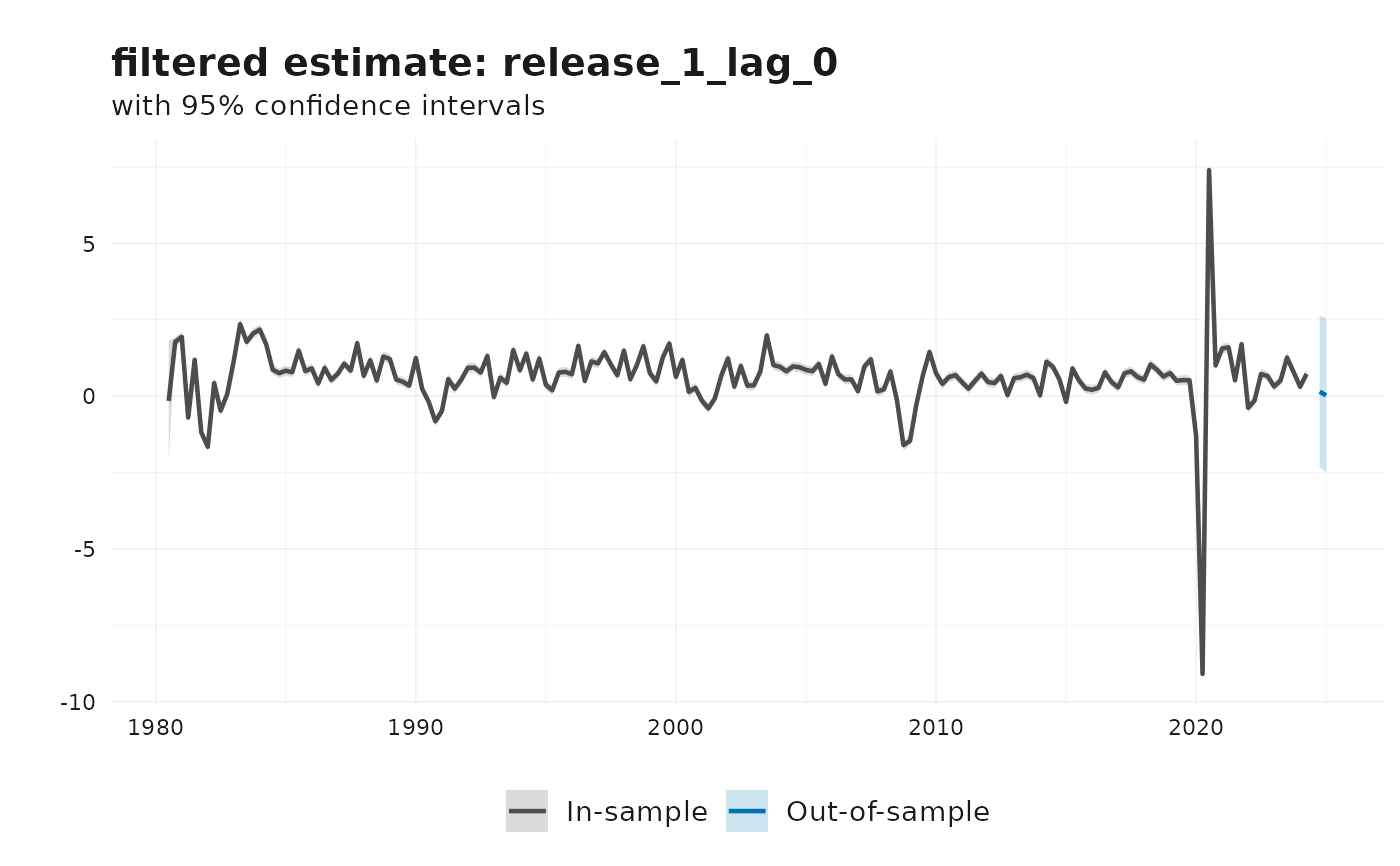
Plot filtered or smoothed estimates for a selected state from a fitted
kk_model.
Usage
# S3 method for class 'kk_model'
plot(x, state = NULL, type = "filtered", ...)Details
This method requires x$states to be available. If the model was
fitted with solver_options$return_states = FALSE, plotting is not
possible.
See also
Other revision nowcasting:
jvn_nowcast(),
kk_nowcast(),
plot.jvn_model(),
print.jvn_model(),
print.kk_model(),
summary.jvn_model(),
summary.kk_model()
Examples
df <- get_nth_release(
  tsbox::ts_span(
    tsbox::ts_pc(
      dplyr::filter(reviser::gdp, id == "US")
    ),
    start = "1980-01-01"
  ),
  n = 0:1
)
df <- dplyr::select(df, -c("id", "pub_date"))
df <- na.omit(df)

e <- 1 # Number of efficient release
h <- 2 # Forecast horizon
result <- kk_nowcast(df, e, h = h, model = "Kishor-Koenig")

plot(result)