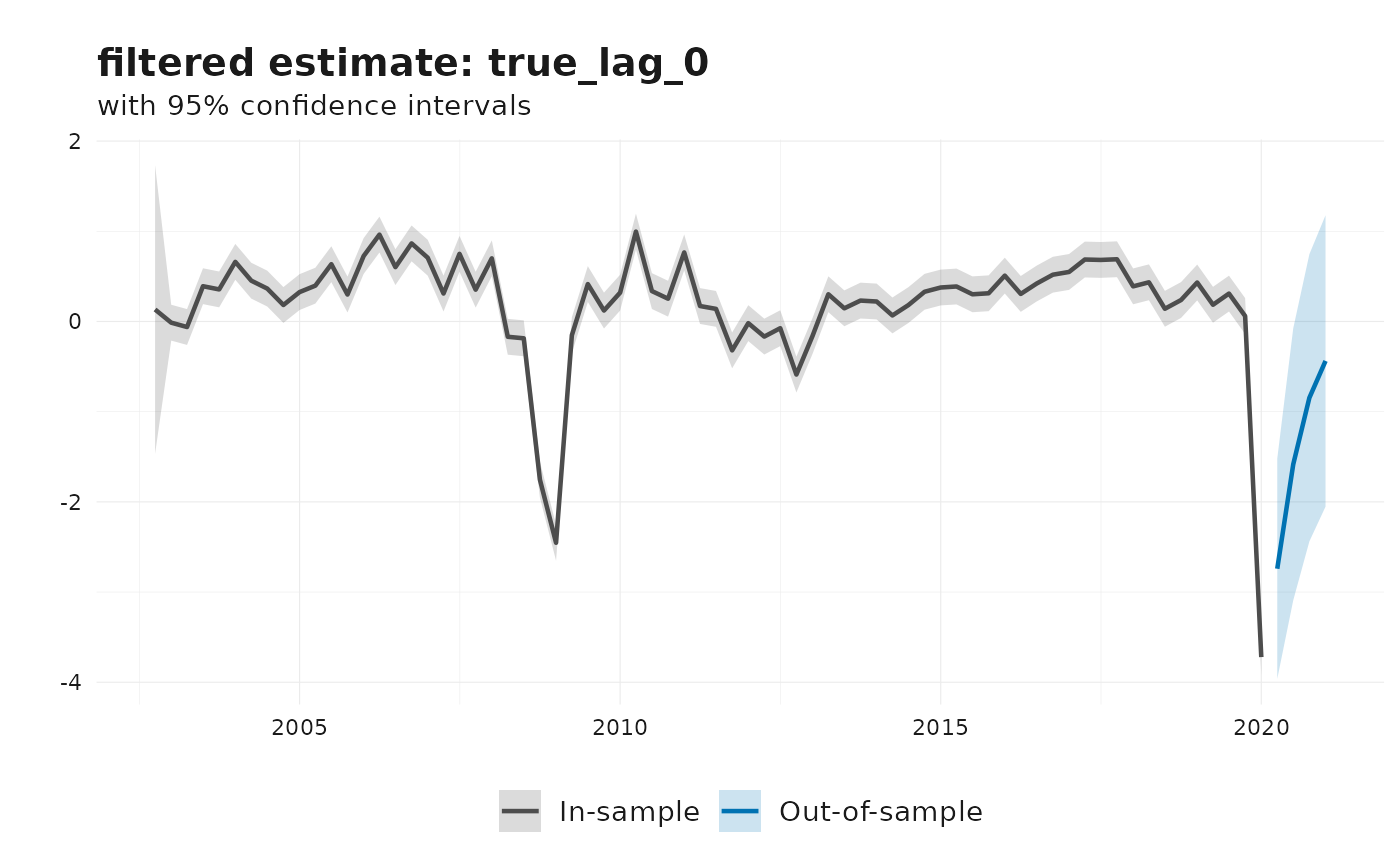
Plot filtered or smoothed estimates for a selected state from a fitted
jvn_model.
Usage
# S3 method for class 'jvn_model'
plot(x, state = "true_lag_0", type = "filtered", ...)Details
This method requires x$states to be available. If the model was
fitted with solver_options$return_states = FALSE, plotting is not
possible.
See also
Other revision nowcasting:
jvn_nowcast(),
kk_nowcast(),
plot.kk_model(),
print.jvn_model(),
print.kk_model(),
summary.jvn_model(),
summary.kk_model()
Examples
# \donttest{
gdp_growth <- dplyr::filter(
  tsbox::ts_pc(reviser::gdp),
  id == "EA",
  time >= min(pub_date),
  time <= as.Date("2020-01-01")
)
gdp_growth <- tidyr::drop_na(gdp_growth)
df <- get_nth_release(gdp_growth, n = 0:3)

result <- jvn_nowcast(
  df = df,
  e = 4,
  ar_order = 2,
  h = 0,
  include_news = TRUE,
  include_noise = TRUE
)
plot(result)

# }
# }