Provides a compact default plot for the main result class returned by
auto_seasonal_analysis(). The plot is intended for quick inspection; the
HTML report remains the richer review artifact.
Arguments
- x
An object returned by
auto_seasonal_analysis().- series
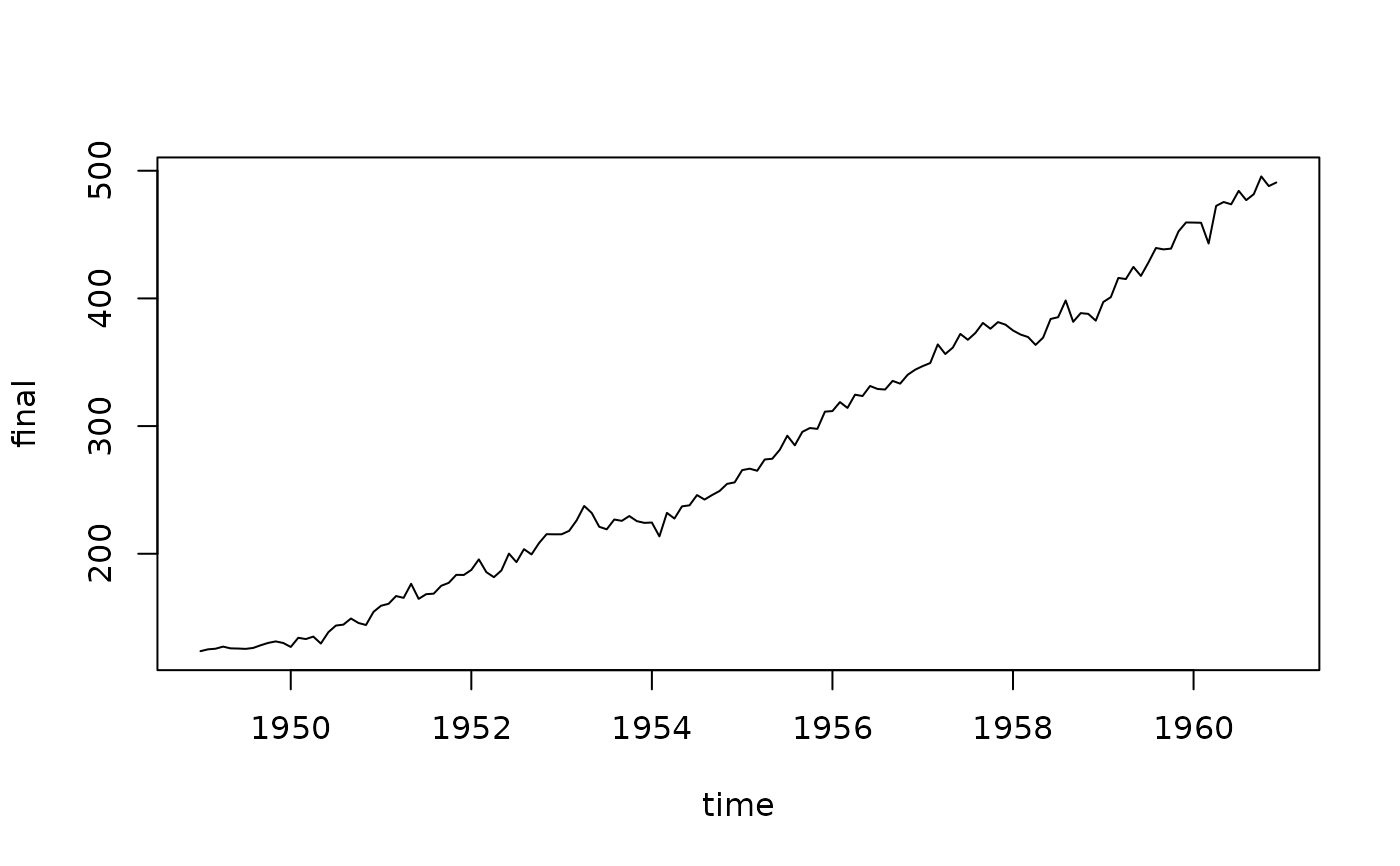
Which series to show.
"final"plots the selected seasonally adjusted series when available and falls back to the original series for do-not-adjust cases."seasonal"plots the selected seasonal component when available."original"plots the original input series stored in the result.- xlab, ylab
Axis labels.
- ...
Additional arguments passed to
stats::plot.ts().
Examples
# \donttest{
if (requireNamespace("seasonal", quietly = TRUE)) {
  res <- auto_seasonal_analysis(AirPassengers, max_specs = 3)
  plot(res)
}
#> Model used in SEATS is different: (1 1 2)(1 0 0)
#> Model used in SEATS is different: (1 1 2)(1 0 0)
#> Model used in SEATS is different: (1 1 2)(1 0 0)

# }
# }